Arshina Khan
Lifestyle BloggerA Certified Data Analyst by Interest & Digital Marketing Specialist Professionally, I am here to help people learn and prepare

A Certified Data Analyst by Interest & Digital Marketing Specialist Professionally, I am here to help people learn and prepare
In June 2025, the aviation world was shaken by a tragic incident involving an Air India flight, underscoring the critical need for continuous monitoring and safety improvements across airlines. The Air India aircraft, operating an international route, experienced a crash landing due to a combination of technical failures. While lost were 242 passengers, including cabin crew and pilots. The crash highlighted serious questions about predictive maintenance, flight data analysis, and air traffic decision-making protocols.
As investigators dove deep into Flight Data Recorders (FDR) and Cockpit Voice Recorders (CVR), aviation analysts, safety experts, and data scientists all turned to one vital question:
Can advanced analytics tools like Power BI and Excel help prevent future aviation accidents?
Yes, a good flight data analysis can save many lives.
Let’s Deep Dive into Global Airline Incidents, Fatalities & Risk Metrics
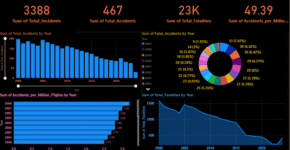
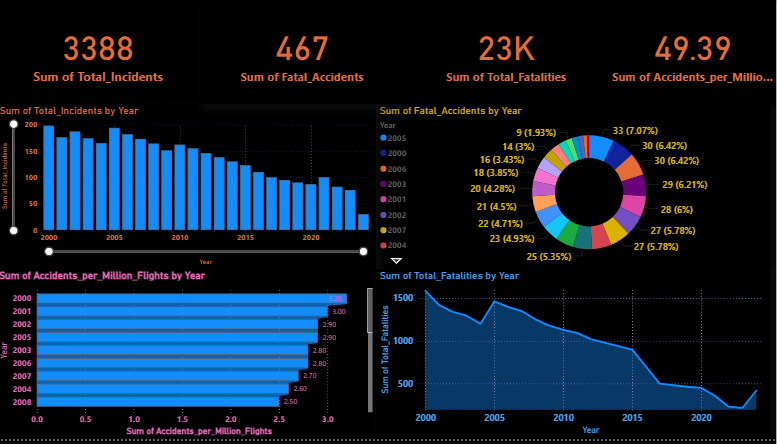
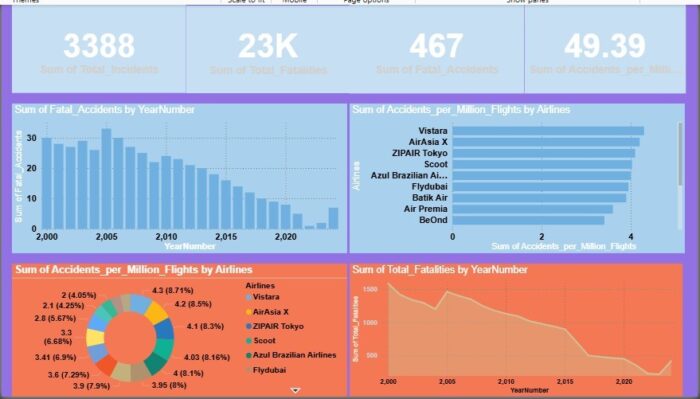
This dashboard visualizes global airline safety data, focusing on incidents, fatal accidents, fatalities, and accidents per million flights across the years and various airlines. The insights were built using Power BI for interactive visuals and Excel for detailed airline-level analysis.
We have taken a dataset from free resources and analyzed it for the betterment of the airline industry.
Key Highlights from Power BI Dashboard
1. Total Metrics (Top KPIs):
Total Incidents: 3,388
Fatal Accidents: 467
Total Fatalities: 23,000
Average Accidents per Million Flights: 49.39
These KPIs offer a quick glance at the overall severity and risk trends in aviation safety across years.
2. 📉 Incidents Over the Years (2000–2023)
Visual: Bar chart
Observation: A clear decline in total incidents year-over-year, showcasing improvement in aviation safety standards globally.
Recent years (post-2018) have shown a significant drop, possibly due to improved technology, regulations, or reduced flights due to the pandemic.
3. 🎯 Fatal Accidents Distribution by Year
Visual: Donut chart
Top Fatal Years:
2007 (33 accidents)
2012 (30 accidents)
2004 & 2010 (~27-30 accidents each)
This shows peak years of fatal accidents and helps us identify what years contributed most to overall fatalities.
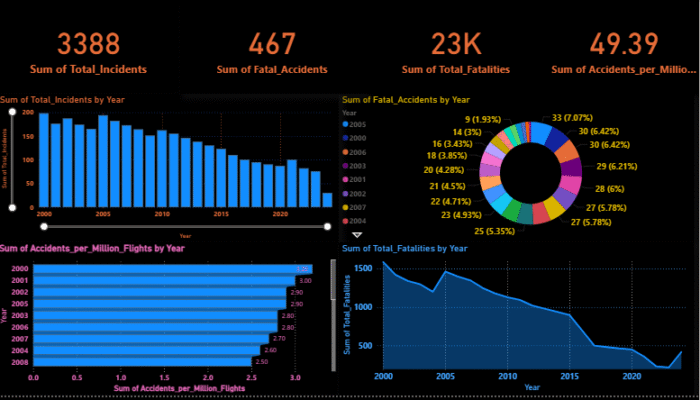
4. 📌 Accidents per Million Flights (Trend)
Visual: Horizontal bar chart
Highest Risk Years:
2008 to 2010 had the highest ratio (~2.8 to 3.0)
Lowest Risk Years:
2020 onward saw reduced accident ratios, likely due to flight operation drops during COVID-19.
5. 🧭 Total Fatalities by Year
Visual: Line chart
Shows a gradual decline in aviation deaths over the past two decades.
Peak fatality years: Early 2000s
Lowest fatalities: Post-2018, hitting lowest around 2021
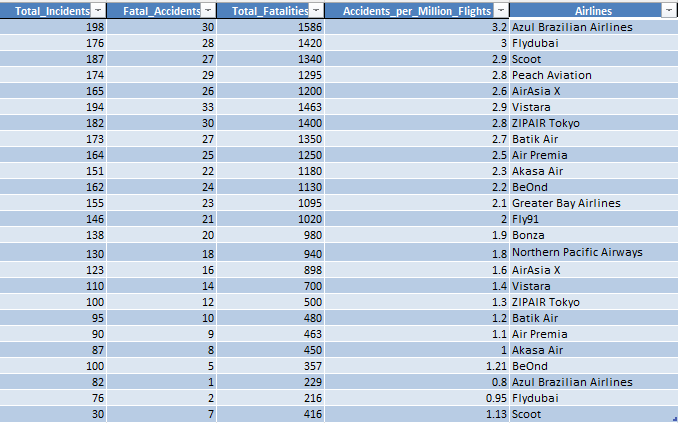
📋 Excel Airline Safety Table (Airline-Wise Data Summary)
This table breaks down the data by individual airlines with the following metrics:
Metric Description
Total_Incidents All reported safety incidents
Fatal_Accidents Number of fatal crashes
Total_Fatalities Number of deaths
Accidents_per_Million_Flights Safety risk measure
Airlines Airline name
🚩 Key Insights from Excel Table:
Most Risk-Prone Airline:
Azul Brazilian Airlines with 3.2 accidents per million flights, 30 fatal accidents, and 1586 fatalities.
Others with High Risk:
Flydubai, Scoot, Peach Aviation, and AirAsia X — all have >2.5 accidents per million flights.
Safer Airlines (Lower Risk):
Flydubai (0.95), BeOnd (1.21), Air Premia (1.1), with relatively low incidents and fatalities.
Duplicate airline names (e.g., AirAsia X, ZIPAIR Tokyo) appear twice with different stats, possibly indicating different operational phases or subsidiaries.
📌 Conclusion & Insights
Aviation safety has improved significantly over time.
Most fatalities occurred before 2015, with a steep decline in recent years.
Airlines with high accident rates must re-evaluate safety practices.
Tools like Power BI and Excel offer a powerful combo for building data-driven dashboards and reports.
This Data is Analyzed by Shubham Sharma—a highly experienced and Data Analyst and MIS Executive
A Certified Data Analyst by Interest & Digital Marketing Specialist Professionally, I am here to help people learn and prepare